Why Liquidity Risk Matters: The KII-USDT Bybit Lesson
A Radar Score of 130 made KII-USDT stand out. Liquidity Risk warned that the opening market could still be fragile. The signals answered different questions.
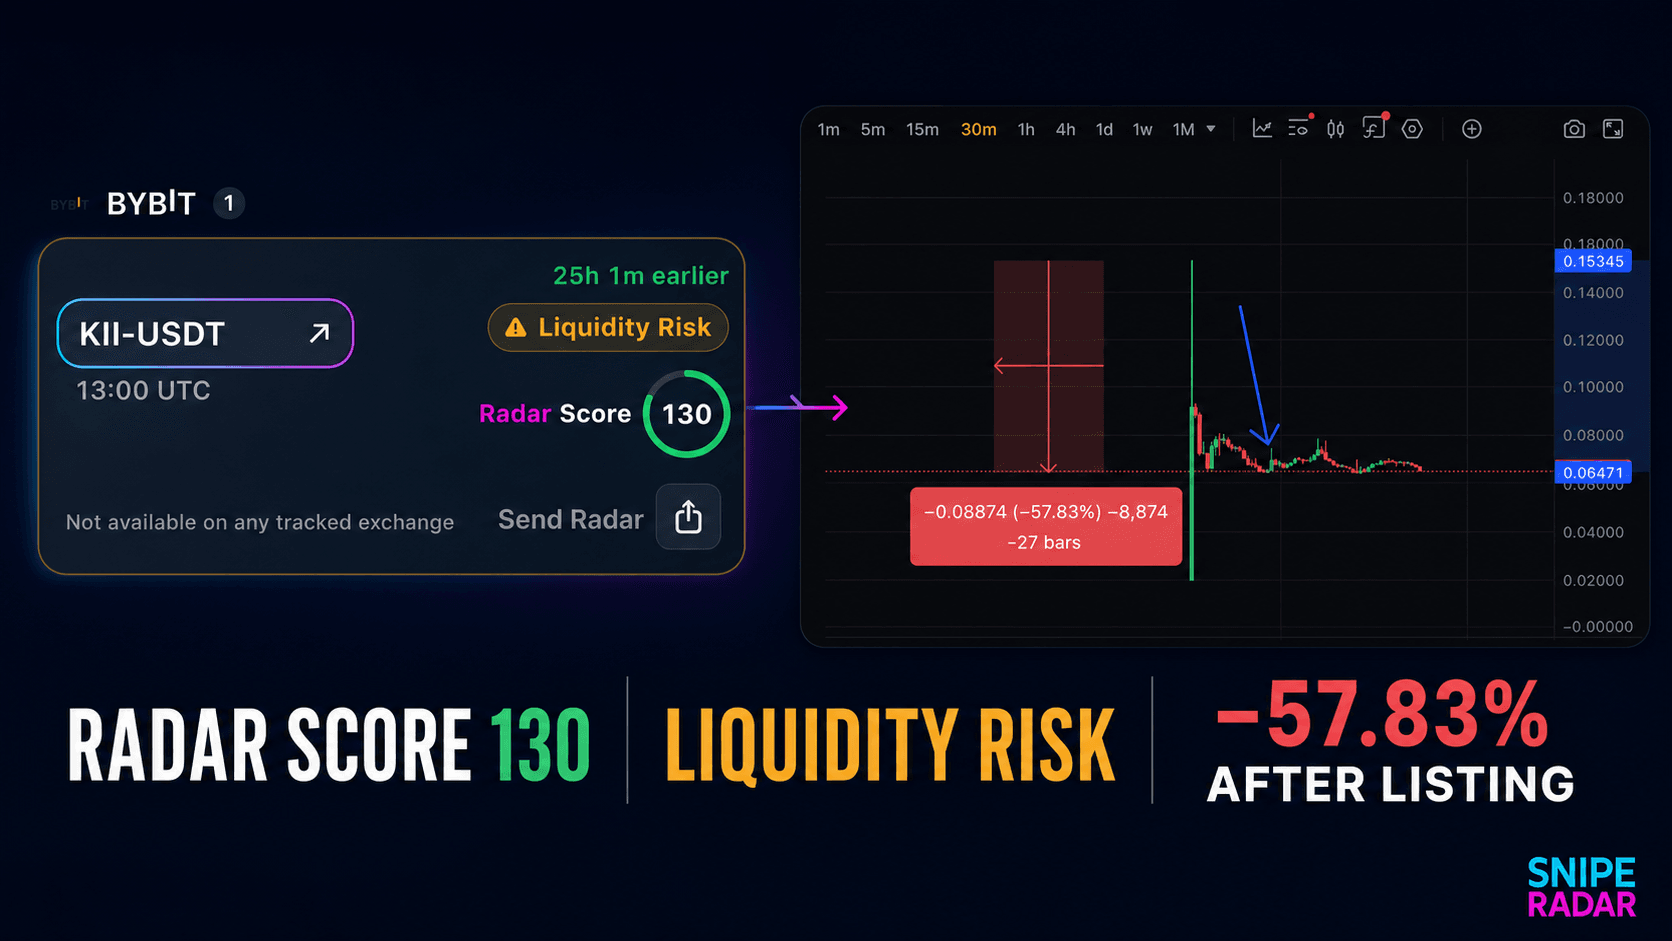
- Radar Score
- 130
- Liquidity warning shown
- Liquidity Risk
- Observed chart move
- −57.83%
- Exchange reviewed
- Bybit
New token listings can attract attention because the first minutes of trading may bring rapid price discovery. They can also produce the least stable conditions: thin order books, wide spreads, slippage and sudden price changes. KII-USDT shows why SnipeRadar presents Radar Score and Liquidity Risk side by side.
One listing, two different questions
Radar Score 130
Radar Score is an automated informational metric based on technical and market-related listing parameters. It helps users compare and prioritize events. It is not a price forecast, token valuation or recommendation to buy.
Liquidity Risk
Liquidity Risk warns that the market may experience conditions such as high volatility, low order-book depth, wide spreads, slippage, delayed execution or difficulty entering and exiting at an expected price.
A high Radar Score can therefore coexist with Liquidity Risk. The score can say, “this event deserves attention,” while the warning says, “the opening market may still be fragile.” Reading only the score removes the context that makes the information useful.
What happened after the listing?
In the supplied 30-minute chart, the highlighted measurement shows a 57.83% decline across 27 bars from the marked high to the later reference price. This is a historical observation, not proof that every trader could execute at either marked price, and not proof that Liquidity Risk predicted the exact direction or size of the move.
What it does show is that the warning was relevant. A listing can receive a strong Radar Score and still enter unstable price discovery. The token is not automatically “doomed,” and the later path may still change. The lesson concerns timing and market structure, not a final judgment about the project.
What to check before acting
- Order-book depth: are there enough bids and offers near the current price?
- Spread: is the gap between the best bid and ask acceptable?
- Slippage: how far could the execution price move?
- Price discovery: has the first burst of volatility begun to settle?
- Other venues: is the token already trading elsewhere?
- Official source: has the exchange changed the pair or opening time?
Continue with primary-source research
Visit the official KiiChain website and KiiChain on X. These links are provided as project sources, not as an endorsement or a change to the risk observations above.
Methodology
This case study uses the SnipeRadar Bybit listing card captured on August 14, 2026 and the supplied 30-minute market chart captured after the listing. The chart annotation reports −57.83% across 27 bars. The value is treated only as an observed chart measurement.