FONE on BingX: Radar Score 64 and a 442% Observed Range
FONE moved through an exceptional historical range after its BingX listing. This case study separates the recorded 442.47% market move from the price a trader could realistically execute.
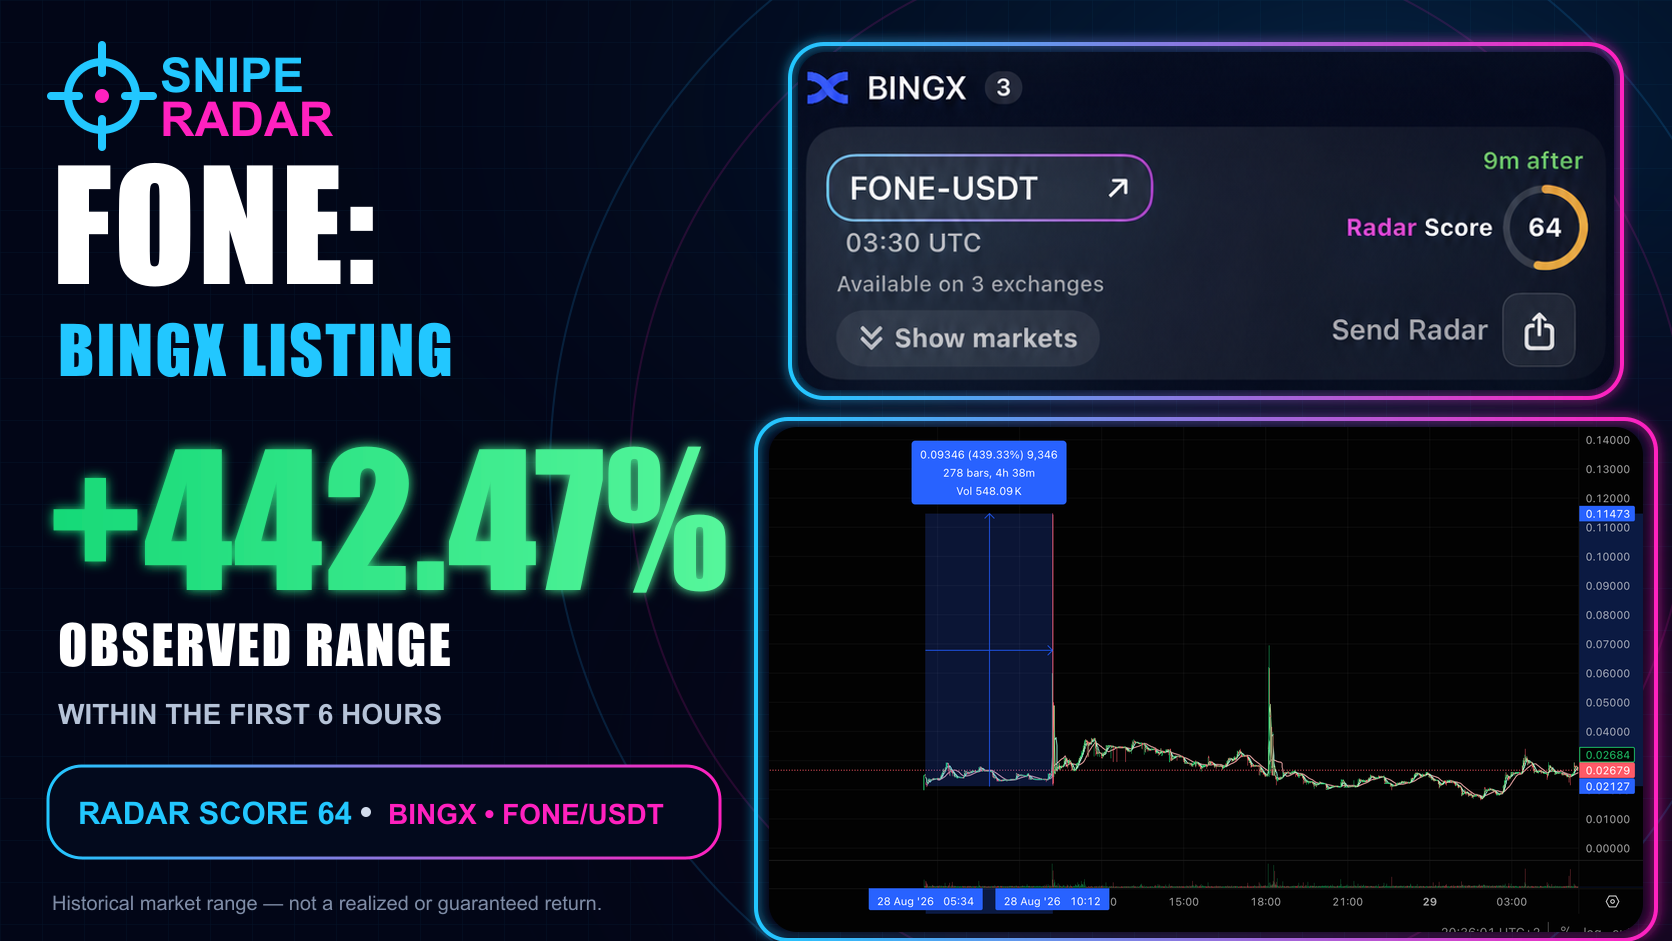
FONE/USDT opened on BingX Spot on August 28, 2026. SnipeRadar recorded the event nine minutes after trading began and assigned a historical Radar Score of 64. During the first six hours, the application later measured a low of $0.02117 and a high of $0.11484—an observed low-to-high range of 442.47%.
That headline number needs context. It describes what the market printed between two historical points. It does not mean that every trader could buy the exact low, sell the exact high or realize a 442% return.
What is Apeonfone (FONE)?
Apeonfone presents itself as a deliberately simple meme narrative: social feeds, callouts, screenshots, group chats and mobile trading reduced to the image of “an ape on a phone.”
BingX describes FONE as a narrative-driven meme coin on the Solana blockchain. The official listing announcement identifies the contract address as CTPoyCwkjMvoJwU4xvZZqoD8tiYk6yDchySiN5gGpump. The project should therefore be assessed as a high-volatility meme asset, not as a protocol with utility claims that its own materials do not make.
The official BingX listing schedule
According to the official BingX announcement:
- Trading pair: FONE/USDT.
- Deposits: August 28, 2026, at 02:30 UTC.
- Spot trading: August 28, 2026, at 03:30 UTC.
- Withdrawals: August 30, 2026, at 02:00 UTC.
- Network: Solana.
- Zero-fee period: August 28 at 03:30 UTC through September 4 at 03:30 UTC.
BingX also notes that an announced trading time is for reference and that the actual opening can depend on deposit requirements. This is one reason official exchange information should always be checked immediately before an intended trade.
Why this article uses Radar Score 64
The later calendar capture and the historical Statistics record do not show the same score. For this historical case study, we use the value preserved in SnipeRadar Statistics for the FONE event: Radar Score 64. The calendar image below has been corrected only to display that historical score instead of the later current value.
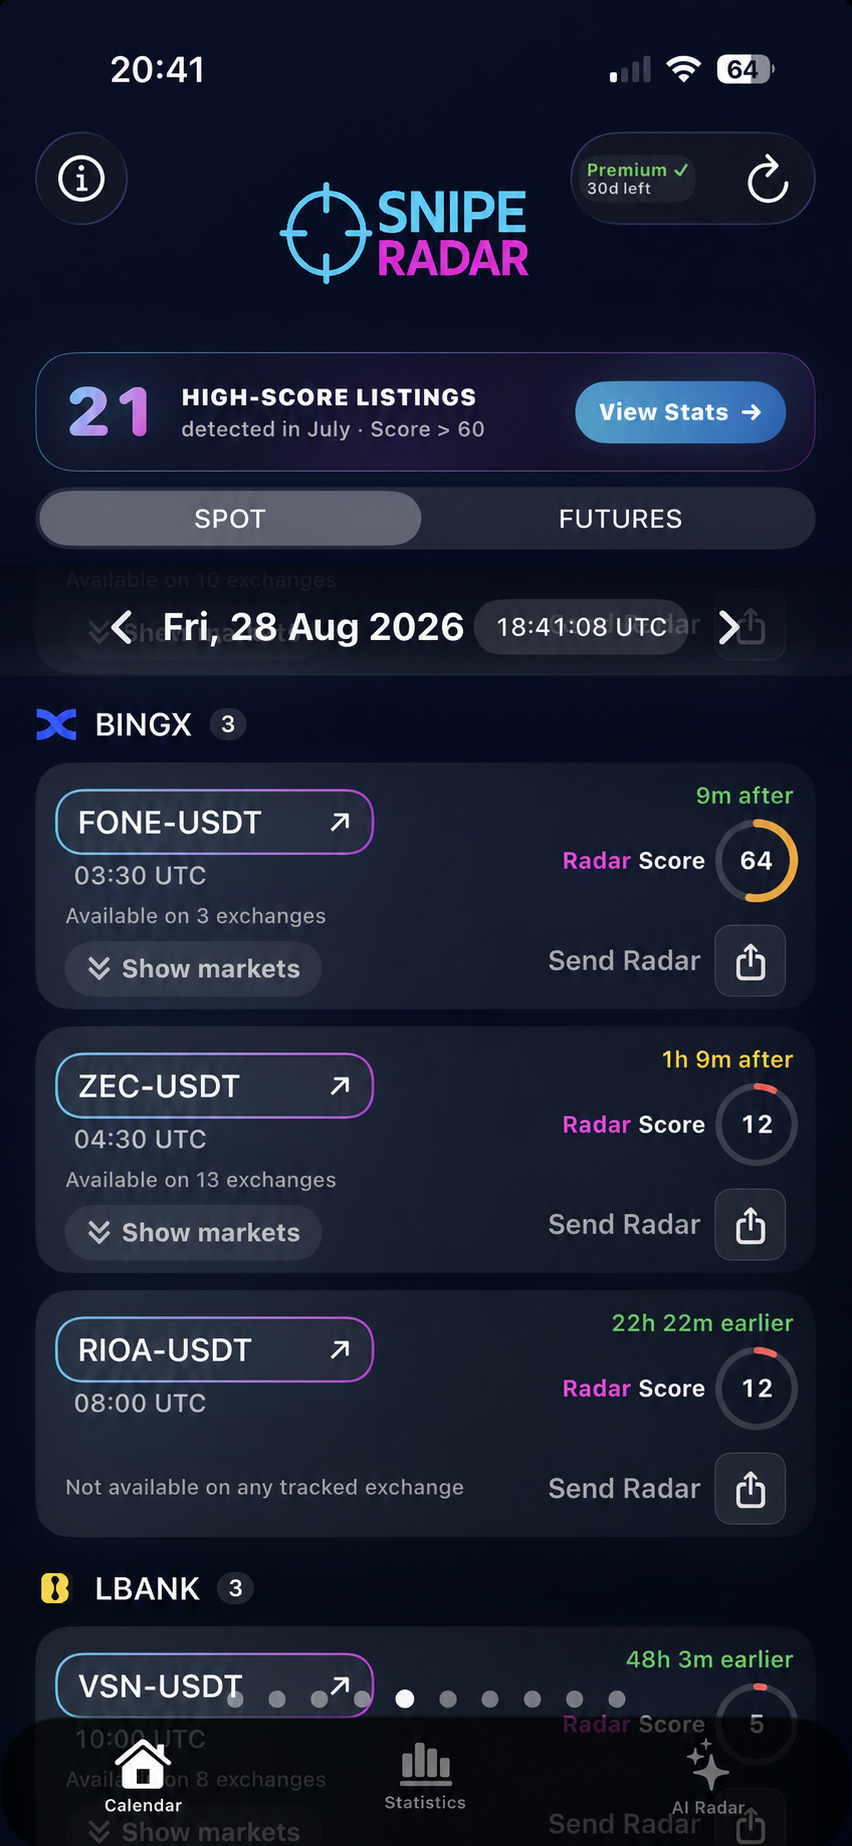
A 442.47% observed range in the first six hours
SnipeRadar Statistics recorded a low of $0.02117 and a later high of $0.11484 within the first six hours after listing. The calculation is:
($0.11484 ÷ $0.02117 − 1) × 100 = 442.47%
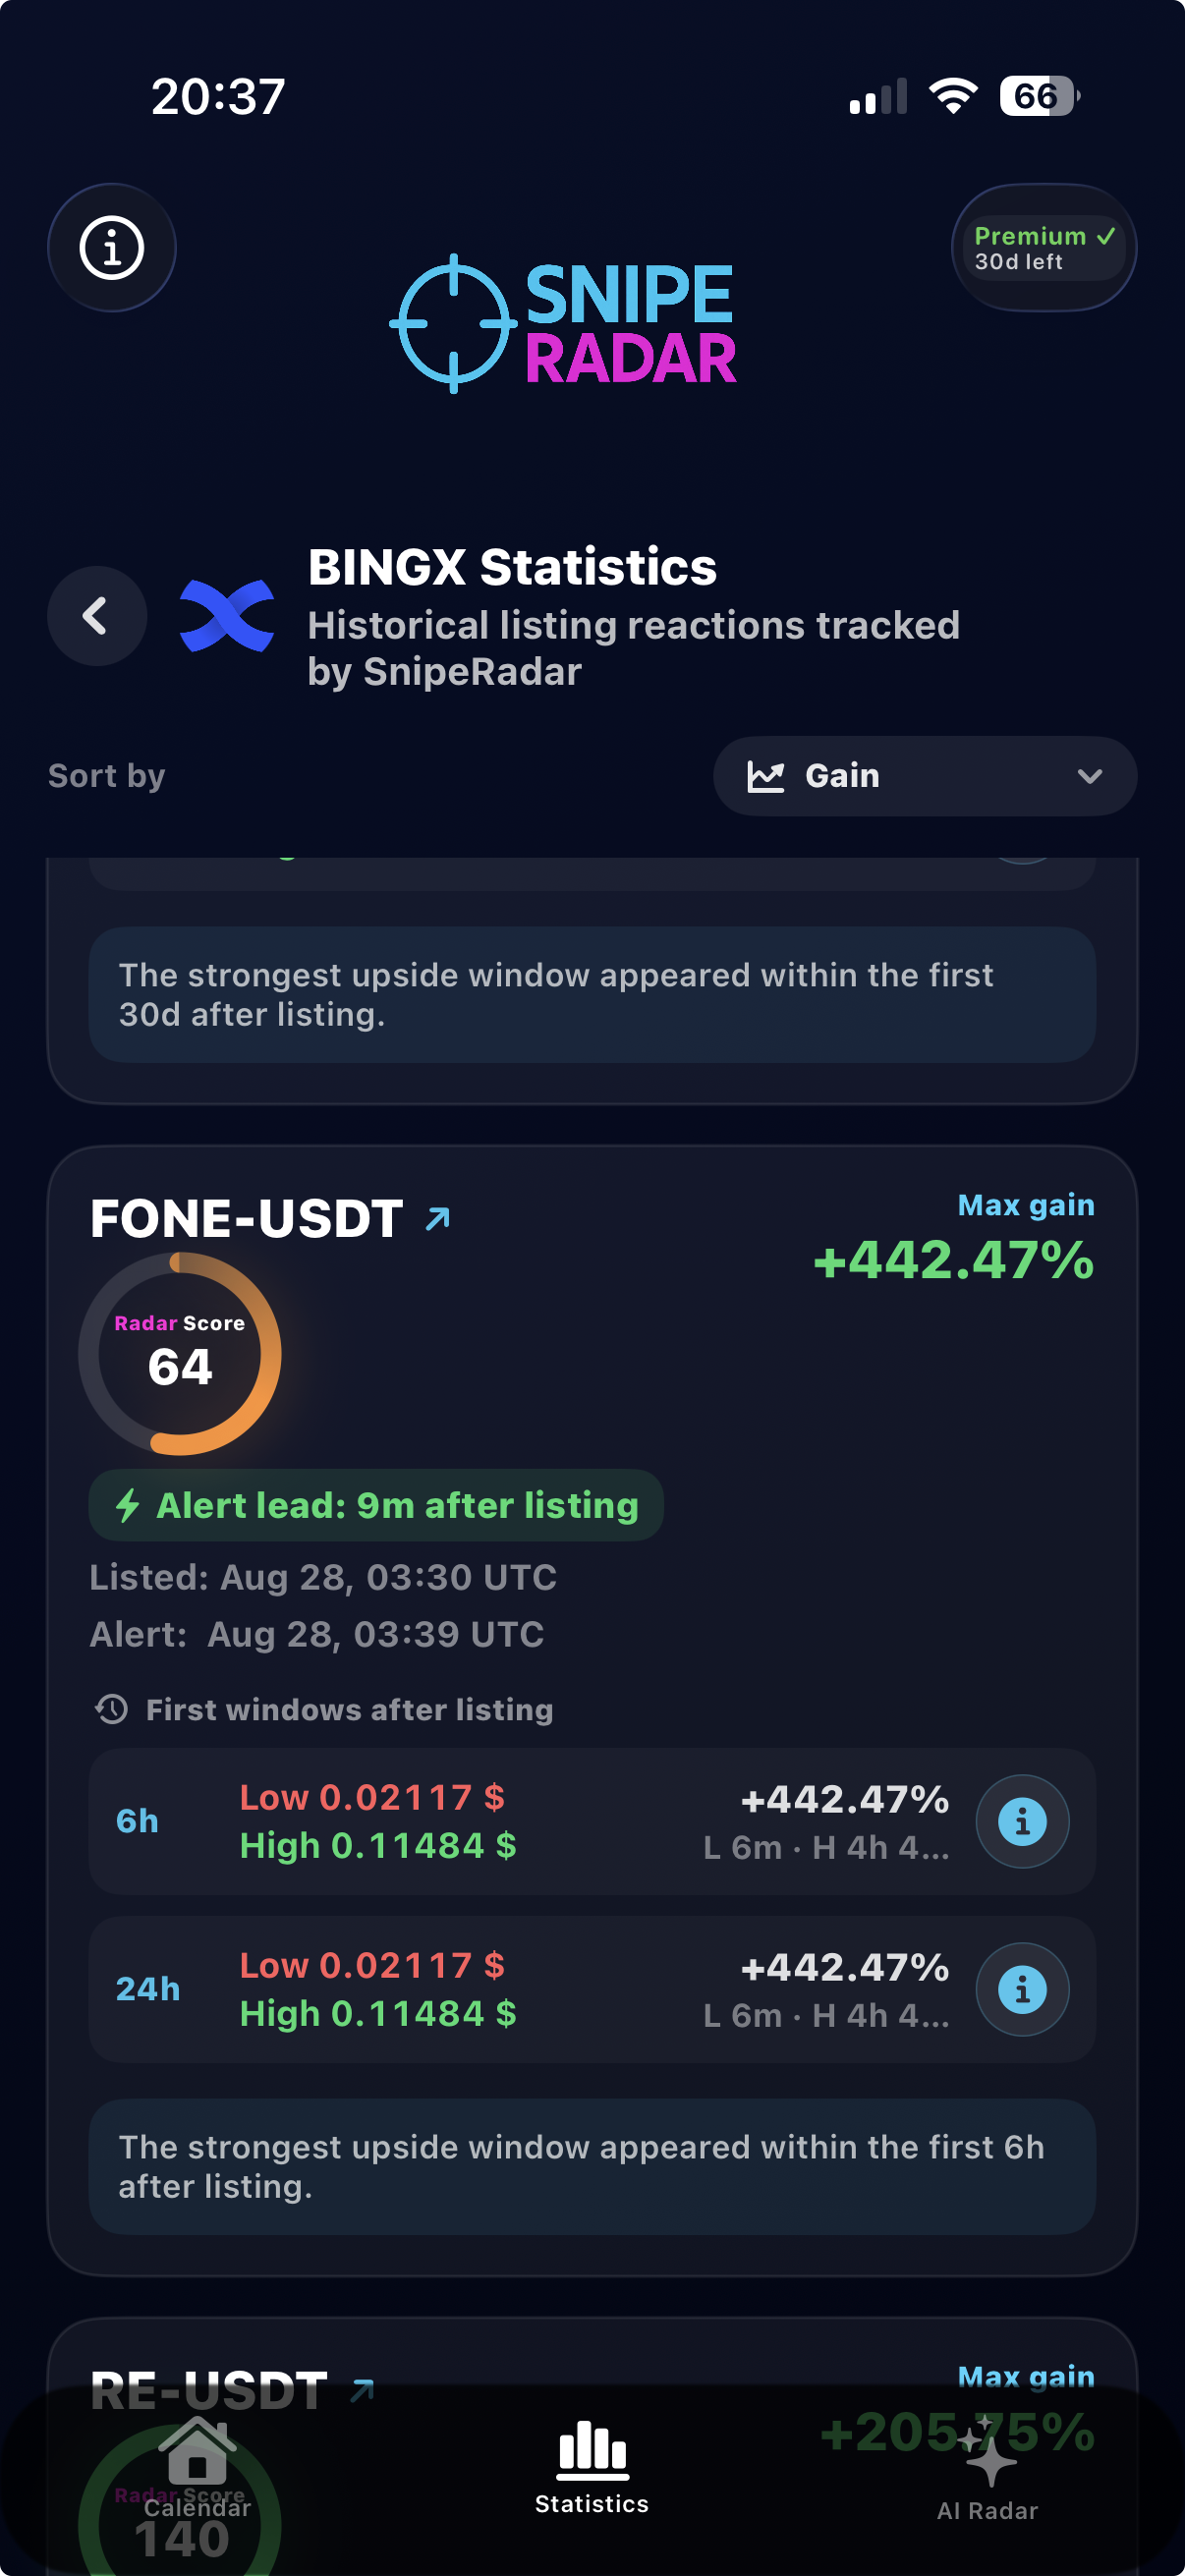
This is a useful description of volatility, but it is not a model trade. The low and high are historical prints, while a real order is affected by available size, spread, queue position, latency, fees and slippage.
Why the bottom of the first candle is not a realistic entry
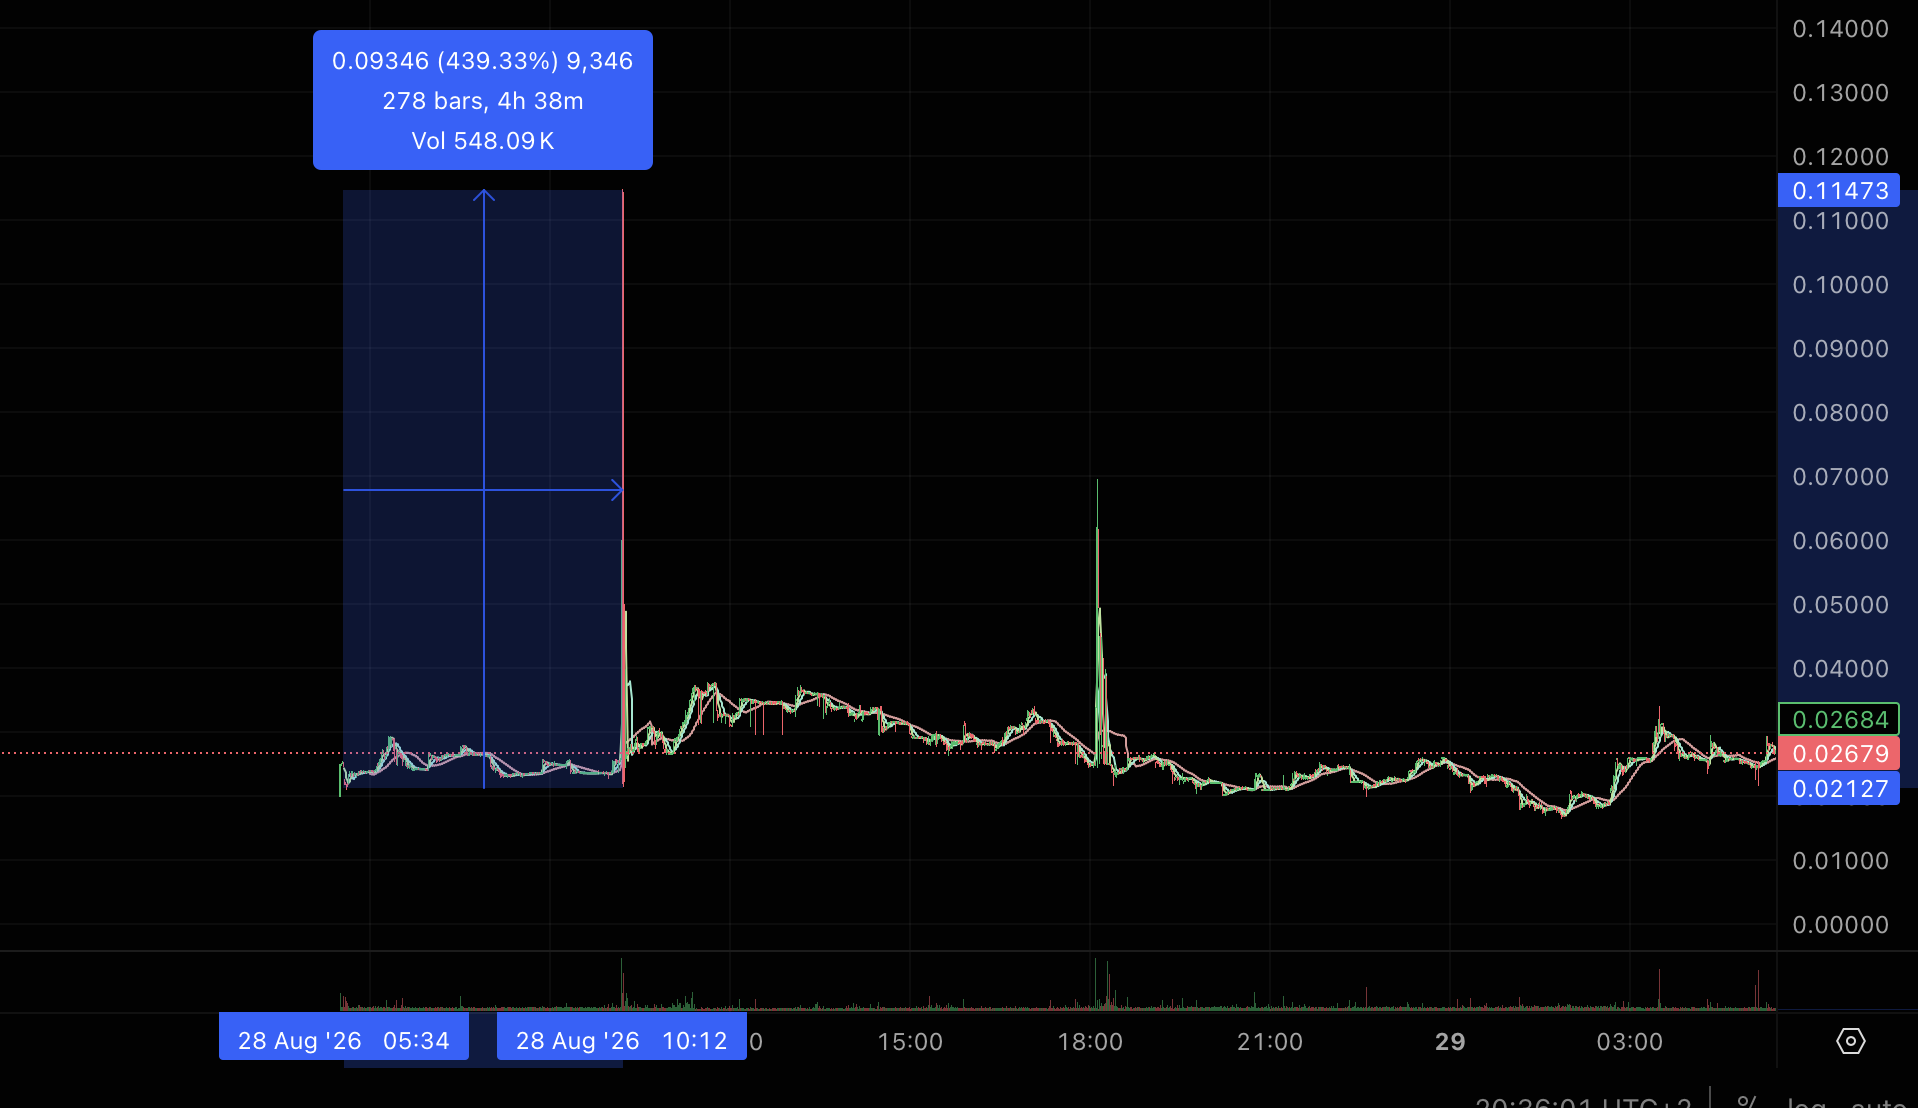
New listings often open with a thin and unstable order book. The lowest point of the first candle can represent a very small trade available for only a fraction of a second. An OHLC chart proves that some transaction occurred there; it does not prove that a typical participant could buy a meaningful amount at the same price.
For a more realistic case study, the entry benchmark should come from prices printed several minutes after the market opened, once executable quotes and order-book depth had started to form. SnipeRadar recorded $0.02117 around six minutes after the listing. Even that price should be treated as a statistical market print rather than an assumed fill.
The timing matters: SnipeRadar’s alert was recorded at 03:39 UTC, nine minutes after the scheduled 03:30 UTC opening. The exact six-minute low therefore occurred before the alert and must not be presented as a post-alert buying opportunity. The later high was part of the subsequent first-six-hour window, but the price available to any user after the alert would have depended on the live order book.
What the FONE case demonstrates
- Radar Score 64 identified a historically notable listing event, even though the alert was recorded after the market opened.
- The strongest observed upside window appeared within six hours, showing how quickly a new listing can move.
- Opening-candle extremes require caution, because a printed low is not the same as a repeatable, liquid entry.
- Transparent timing matters: the six-minute low preceded the nine-minute alert, so it cannot be claimed as a SnipeRadar-enabled entry.
SnipeRadar organizes listing schedules, alert timing, historical scores and post-listing statistics so users can perform their own research with clearer context. It does not provide trading signals or investment advice.